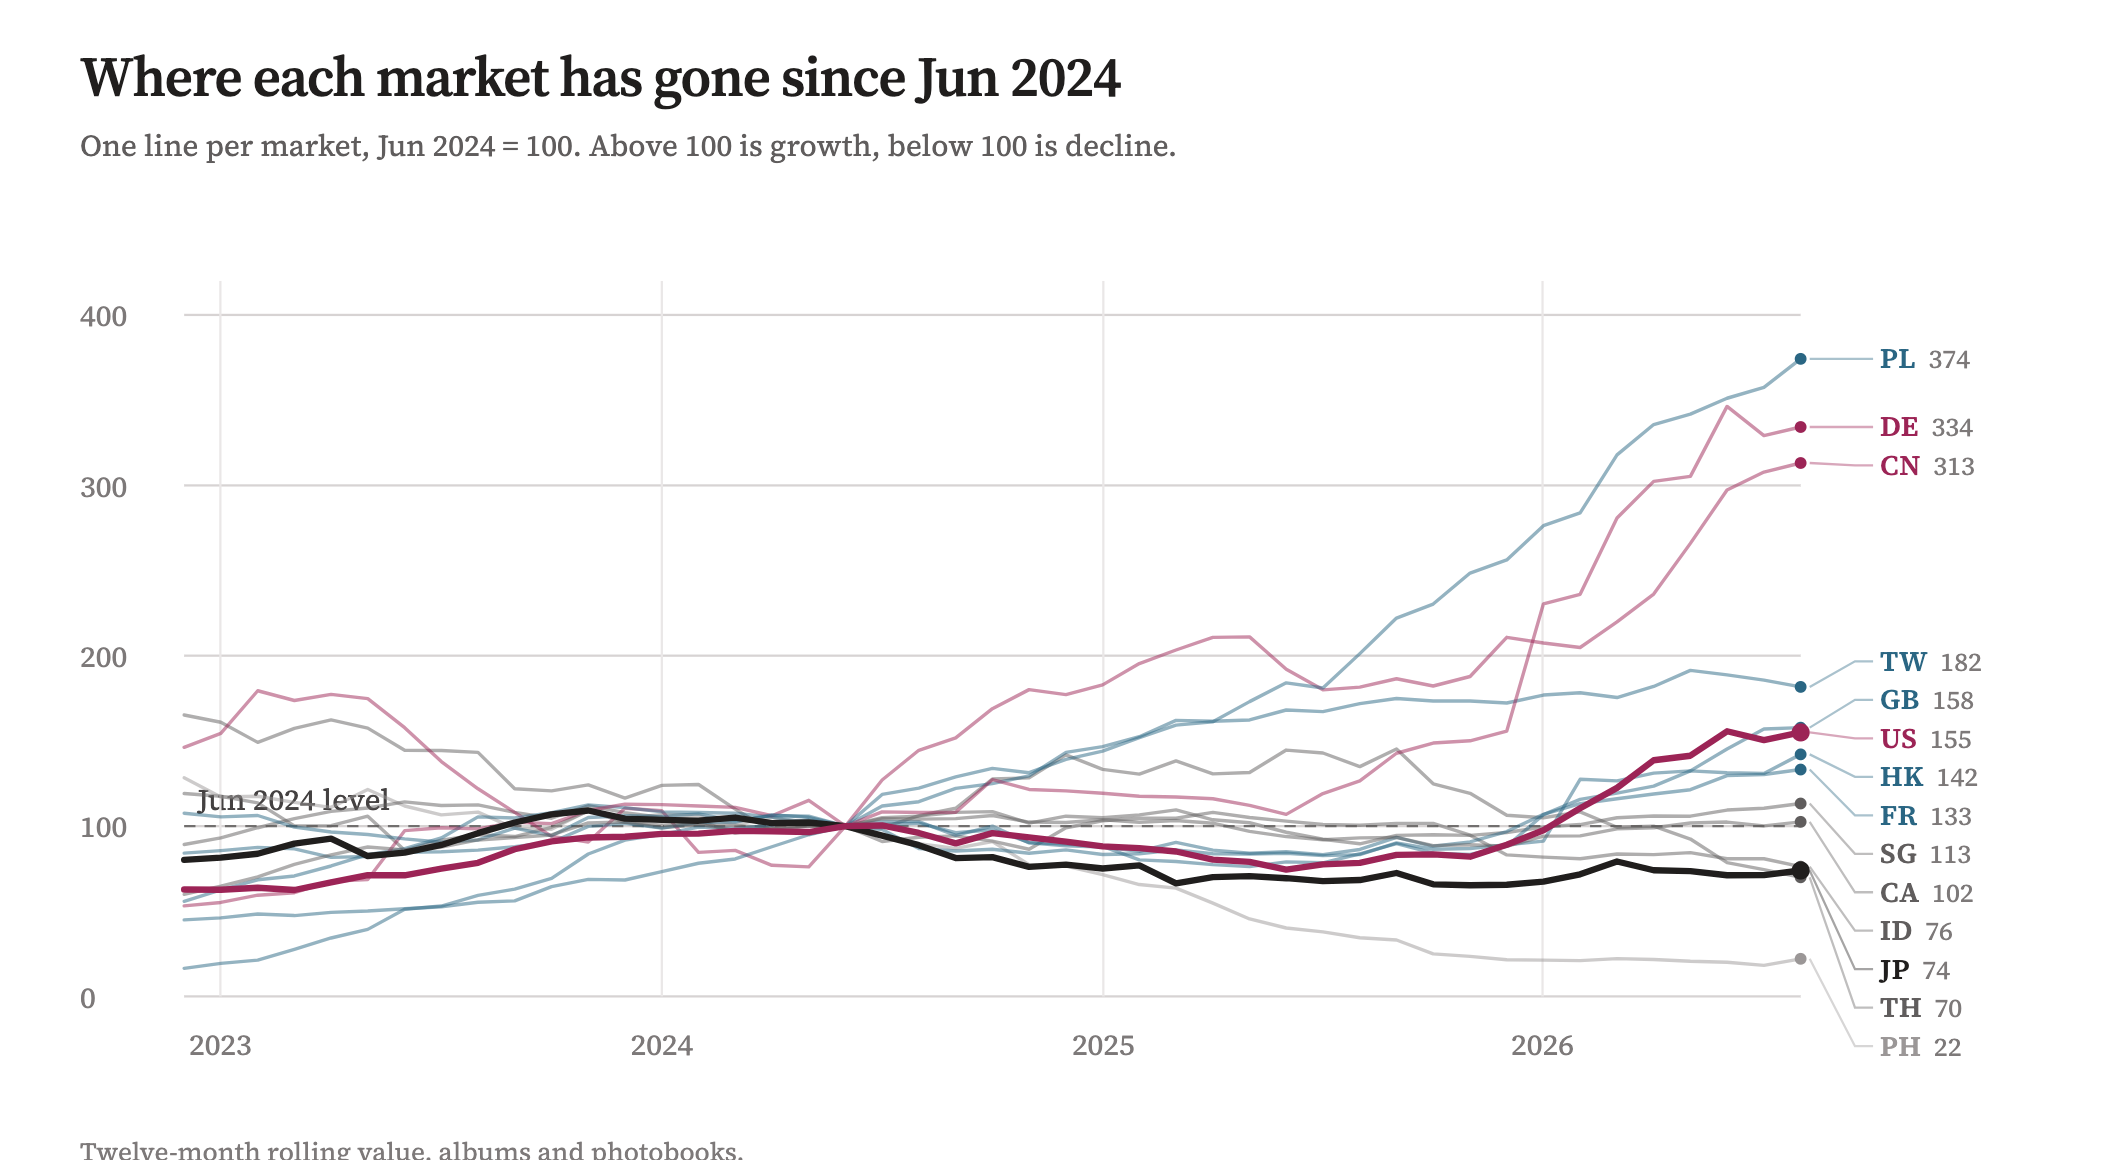
Six K-pop markets peaked in 2022. Fourteen peaked this year.
Album sales fell 16% over two years. Exports didn’t move at all.
The Physical Layer #1 — How K-pop crosses borders
Korean physical album exports are at $360 million through August 2026, already past all of last year and running 72% ahead of the same point in 2025.
That number is easy to misread. Here’s what came before it.
Exports were $354 million in 2023, $351 million in 2024, $358 million in 2025. Three years inside a 2% band. Nothing happening.
Press enter or click to view image in full size
K-POP Sales YoY
Except something was happening. Over those same three years, total K-pop album sales fell 16% — 103.3 million copies in 2023, 86.9 million in 2024, 86.2 million in 2025, per Hanteo. The market shrank by a sixth and exports held completely flat.
More of a smaller pie was leaving the country. That ran for two years before this year’s jump, and nobody wrote about it, because the export total looked boring.
A third number says the same thing
HYBE breaks its revenue out by region in the notes to its annual accounts. Its music division earned ₩630.3 billion domestically in 2023, ₩607.0 billion in 2024, and ₩552.2 billion in 2025 — down 12% over two years.
Everywhere else went the other way. North America up 20%, Asia up 56%, everything else up 147%. Domestic share of the music division fell from 35% to 24% in two years.
Note what that means. Korea didn’t just shrink as a share of a growing business. It shrank in absolute won while the business grew 26%.
Three different sources — a retail sales tracker, customs declarations, and a listed company’s audited accounts — pointing the same way. The domestic market is contracting and everything outside it is picking up the difference.
Two halves, nothing in the middle
The country-level export data says it more sharply.
Pull all 169 destinations and ask not who buys the most, but when each one bought the most. Every country has a single best month in the last five years.
Press enter or click to view image in full size
Country Revenue
Japan’s best month was May 2022. Four years on, still not beaten. Indonesia peaked in June 2022. Vietnam in March 2022, Chile and Mexico in June 2022, Thailand that September. Those six bought $53.1 million in the first half of 2024 and $52.4 million this year. Some are going backwards — Thailand down 48% on the year, the Philippines from $1.66 million to $294,000.
Then fourteen countries whose best month is 2026: the US, China, Germany, Taiwan, Hong Kong, the Netherlands, the UK, Poland, Australia, Spain, Czechia, Italy, Denmark, Malaysia. They’re 76% of album exports now, up from $81.5 million two years ago. Poland and Denmark peaked in August, the last month we have.
In between, almost nothing. France, Canada, Singapore and Russia peaked in late 2023 and drifted. Four countries, 2% of the total.
The market didn’t grow. It moved.
One set of countries stopped buying four years ago; another set picked up the slack. The total sat still while the whole thing was rebuilt underneath.
Geography doesn’t explain the split. Both halves are mostly Asian. Japan and Southeast Asia stalled while China, Taiwan and Hong Kong together went from $36.5 million to $87.7 million — a bigger jump than all of Europe put together. Germany and the Netherlands are neighbours on opposite sides of it.
Population doesn’t explain it either, though the numbers are worth seeing. Taiwan buys $944 per thousand people. Hong Kong $901. Japan $426. Germany and the Netherlands around $263. The US, first by total value, comes sixth at $229 — Taiwan buys four times as densely. Japan is third on that list while going nowhere, which is the useful bit: a market that’s full and a market that’s fading look identical in a snapshot.
Press enter or click to view image in full size
Markets ranked — per-1,000-people view
So the question isn’t why exports are up this year. It’s why the same albums, from the same labels, on the same release dates, land so differently depending on where they go.
What photobooks tell you
Photobooks ship under their own customs code, and putting them next to albums sorts growth into two kinds. Albums jumping alone means something specific caused it — a comeback, a chart push. Albums and photobooks climbing together means the shelf itself got bigger.
Photobook exports actually fell, $18.2 million to $16.2 million, which rules out the boring explanation that albums are just being counted differently now.
Country by country: the US, China, Germany, Spain, Czechia and Italy grew in albums only. Taiwan, Hong Kong, the Netherlands, the UK, Poland, Denmark, Australia, Malaysia and Mexico grew in both.
That line runs across regions, not along them.
Next year is the test
Four months left in 2026. If they only match last year’s, the annual figure clears $500 million.
The more interesting thing to watch is which half each country lands in. If the US and China fail to beat their 2026 peaks next year, this was a release cycle. If Europe keeps climbing while domestic sales keep shrinking, it wasn’t.
That’s what these monthly posts will track: the running numbers, plus one region looked at properly each time. Europe first, then Japan, then China / Taiwan / Hong Kong — one bucket, three patterns — then Southeast Asia and North America.
Live data: patternst.com/en/trade
Where this comes from.
Export figures: Korea Customs Service via the public data portal. FOB values, final destination country.
Albums are HS 8523.49–1040, photobooks HS 4911.91–9000.
Sales figures are Hanteo Chart, which counts sales through its member retailers including some overseas. It isn’t the same universe as customs-declared exports, so the two are compared as trends, not as a ratio.
HYBE figures come from the revenue-by-region note in its annual reports filed to DART.
Next: Europe — the fastest-growing region, and the one that can’t agree with itself.
Get the next one in your inbox
One email per new post. No spam, unsubscribe anytime.
By subscribing you agree to our privacy & marketing email policy.